Client reports
Your portal has three screens — Dashboard, Invoices and Profile — and the Dashboard is the report. It shows coverage, hours delivered and incident counts for your own sites over a date range of up to 92 days. Nothing on it can be exported; the only file you can download is an invoice PDF.
Where is the reporting?
On the Dashboard, which is the first thing you land on. There is no separate reports screen — your portal's navigation has exactly three entries, Dashboard, Invoices and Profile, and any other address you try is sent back to the Dashboard.
The Dashboard describes itself as Coverage, hours delivered, and incidents across your sites, and that is precisely its scope: three sections of counts and charts, covering only the sites recorded against your organisation.
Before you start
- A Client login, issued by the company that provides your security. You cannot create one yourself; the Profile screen's contact details are marked Managed by your service provider.
- At least one site recorded against your organisation. The whole Dashboard is scoped to that list — with no sites, every request behind it fails with No sites.
What can I actually see?
Three sections, each with its own headline numbers and two charts.
Coverage and attendance
| Number | What it counts |
|---|---|
| Fill rate | Shifts with somebody on them, as a percentage of shifts scheduled at your sites. Cancelled and no-show in-house shifts are left out of both halves |
| Check-call compliance | Welfare check calls made, as a percentage of the check-call slots that have closed |
| Missed check-calls | Slots whose window closed with nothing logged against it |
| Scheduled shifts | The denominator of the fill rate |
Charts: Check-call compliance trend by day, and Fill rate by site.
Compliance counts only welfare check calls. Booking on and booking off are attendance, not check calls, and are excluded. So is any slot whose window is still open — a shift running right now cannot drag the figure down until its windows have closed.
Hours delivered
Total hours and Avg hours / shift, with a Hours trend by day and Hours by site. These are the hours you are charged for, not the hours anyone was paid for: in-house shifts contribute their charge-side hours from the shift's finalised record, and only where that shift is marked for invoicing. Agency officer shifts contribute time worked, from their actual start and end where those were recorded and the scheduled times otherwise, less the break.
Incidents and patrols
Total submissions and Incidents, with a Submissions trend by day and a By template breakdown.
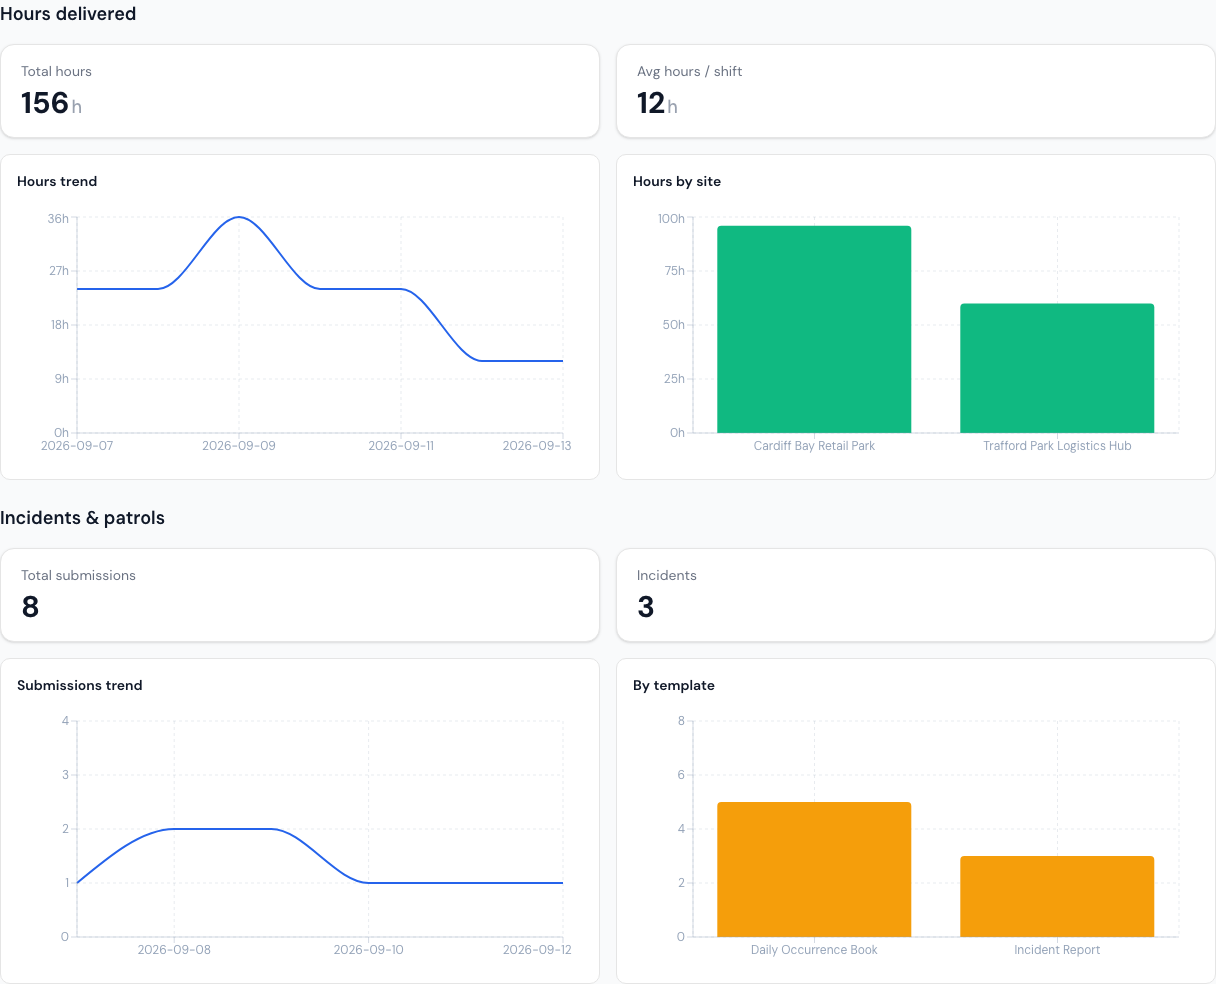
Read "Incidents" carefully. It is the number of submissions on templates whose name contains the word "incident" — so a form called "Incident Report" counts and one called "Occurrence — assault" does not. It is a count of paperwork filed, not an assessment of severity.
How do I set the range?
- Open Dashboard. It opens on the current calendar month, so if you are looking for last month's figures you will see zeros until you change it.
- Set From and To, or press one of This month, Last month or Last 30 days.
- Leave Site on All sites, or pick one of your sites to narrow every section at once.
- All three sections reload against the new range. Coverage figures are held for about five minutes, so a very recent change may take a moment to appear.
The range cannot exceed 92 days. Ask for more and every section shows Range exceeds 92 days rather than a partial answer. For a full year, take it a quarter at a time.
Can I export it?
Not the Dashboard. There is no download, export or print control anywhere on it — the figures are for reading on screen, and the only way to pass them on is a screenshot or retyping them.
The one file you can download from the portal is an invoice PDF, from the Download link on each row of the Invoices screen.
If you need the underlying detail — which officer, which shift, which incident — it is not in the portal at any depth. The Dashboard deliberately returns counts only: no form answers, no name of whoever submitted a form, no photographs or locations attached to one, and no rates or pay figures of any kind. Ask your provider for it directly.
What is on the Invoices screen?
Every invoice your provider has issued to you, newest first, under the heading Your issued invoices and payment status: Invoice, Period, Issue Date, Total, Outstanding, Status and a PDF column with a Download link.
Status is one of Issued, Part Paid, Paid or Void. Outstanding is the total less anything recorded as paid, and never goes below zero.
An invoice your provider is still drafting is not shown here and cannot be downloaded — only issued invoices reach you. If the list reads No invoices yet, nothing has been issued to your organisation yet.
The screen is read-only. There is no way to pay, dispute or void an invoice from it.
If it goes wrong
Everything reads zero. Check the range first. The Dashboard opens on the current calendar month, which is often the wrong month for the question you are asking, and each section says No coverage data for this range / No hours delivered for this range / No form submissions for this range when it genuinely has nothing.
"Range exceeds 92 days". Shorten the range. Nothing else will clear it.
A site is missing from the Site menu. The menu lists the sites recorded against your organisation and still active. A site that has been closed or was never linked to you will not appear, and its shifts are not in any of the figures either. Ask your provider to check how the site is recorded.
Check-call compliance looks low on a day you know went fine. A missed call is a call whose window closed with nothing logged — not a shift anyone abandoned. A call logged after its window shut still counts as missed.
Fill rate is below 100% but every shift was covered. An open shift raised with an agency that has not yet been filled sits in the denominator; a cancelled in-house shift does not. Compare against the Scheduled shifts count before drawing conclusions.
The Incidents number does not match what you were told. It keys off template names containing "incident". Look at the By template chart to see which templates the count is drawn from.
You are bounced to the Dashboard from any address you type. That is the portal working as intended. Client logins can reach only the three screens; the wider application is not available to you.
Related
Last updated 2026-08-13